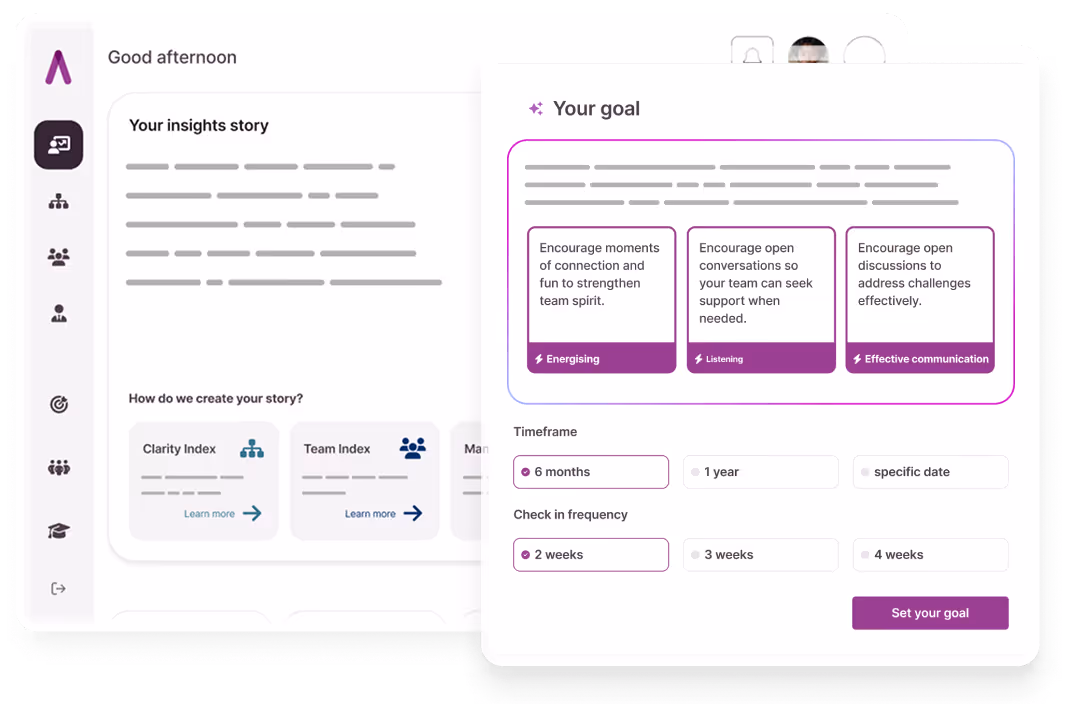
Fast, frequent insight made simple.
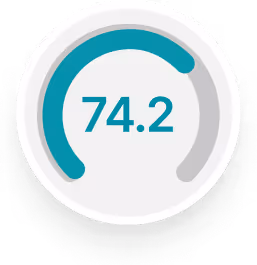
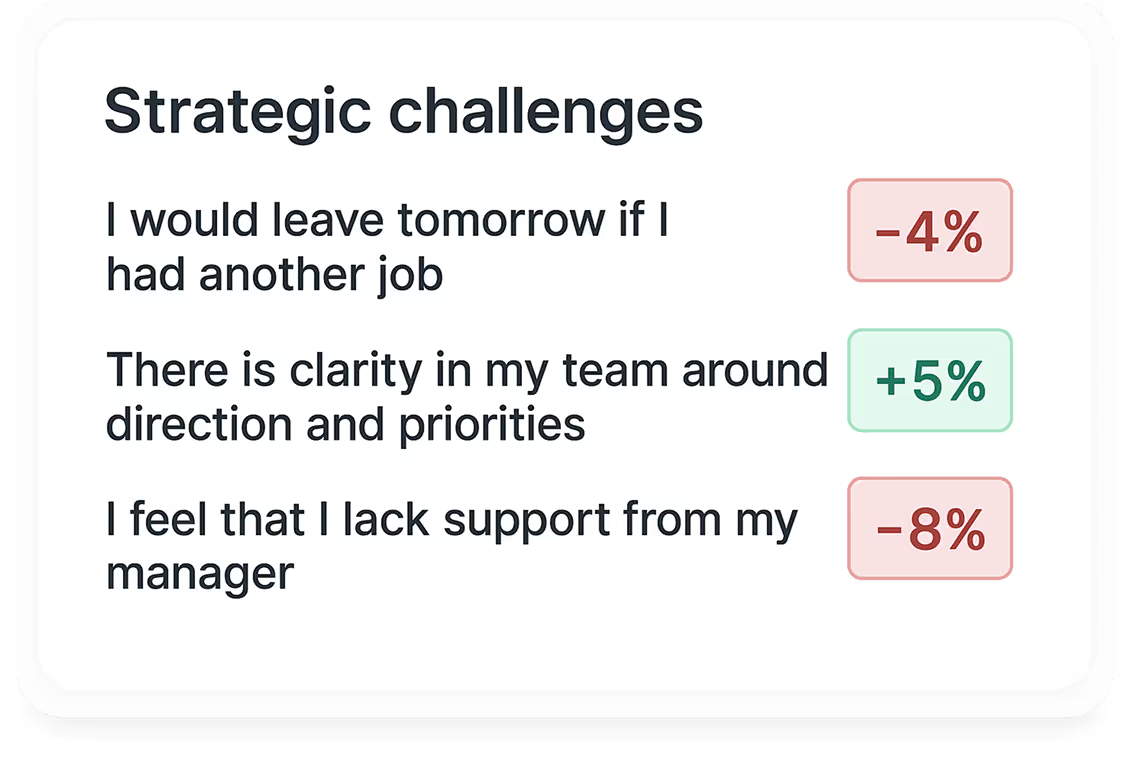
Get a clear, real‑time view of how your people are feeling with a quick, lightweight survey experience. By asking just 8 statements, you can unlock an indicative engagement score - giving you meaningful insight early and helping you spot trends ahead of annual or biannual surveys. Run flexible, targeted Pulse Surveys to specific groups, teams, or custom people lists whenever you need a temperature check.
Available on Improve and Elevate plans only


.png)